Overview
The article emphasizes four strategies for creating effective dashboards to track title status:
- Identifying key metrics
- Selecting appropriate tools
- Integrating dashboards into workflows
- Establishing a feedback loop for continuous improvement
Evidence supports these strategies, demonstrating that proper metric tracking, user-friendly tools, and iterative feedback can significantly enhance operational efficiency and decision-making in title research processes.
Introduction
Effective dashboards serve as indispensable tools for organizations aiming to streamline their title status tracking processes. By leveraging the right metrics and technologies, companies can convert data into actionable insights, thereby enhancing operational efficiency and client satisfaction.
However, a significant challenge arises not only in selecting the most suitable dashboard tools but also in seamlessly integrating them into existing workflows.
How can organizations guarantee that their dashboards not only track title status with precision but also evolve through continuous feedback and improvement?
Identify Key Metrics for Title Status Tracking
To effectively monitor status, identifying (KPIs) that align with organizational goals is essential. Common metrics include:
- Title Search Completion Rate: This metric measures the percentage of title searches completed within a specified timeframe, providing insight into operational efficiency. As Peter Drucker stated, "What gets measured gets managed," underscoring the importance of tracking this metric.
- Error Rate in Document Reports: Monitoring the occurrence of mistakes in document reports enables organizations to evaluate the precision of their inquiry processes, which is crucial for upholding industry credibility. According to industry reports, the average error rate in document reports can significantly impact client trust and satisfaction.
- Average Time to Complete Ownership Searches: This metric indicates the efficiency of the ownership research process, allowing firms to benchmark their performance against industry standards and identify opportunities for improvement. Historical data shows that firms with shorter completion times often experience higher client retention rates.
- Customer Satisfaction Score: Collecting feedback from clients regarding the clarity and usefulness of reports ensures that services align with client expectations, thereby improving overall satisfaction. A recent survey indicated that approximately 70% of clients prioritize clear communication in service offerings.
Focusing on these metrics enables investigators to utilize dashboards for tracking title status, gain valuable insights into their performance, recognize areas for enhancement, and ultimately improve the effectiveness of the title evaluation process. As industry leaders emphasize, effective measurement is key to driving progress and achieving strategic objectives.
![]()
Select Appropriate Dashboard Tools and Technologies
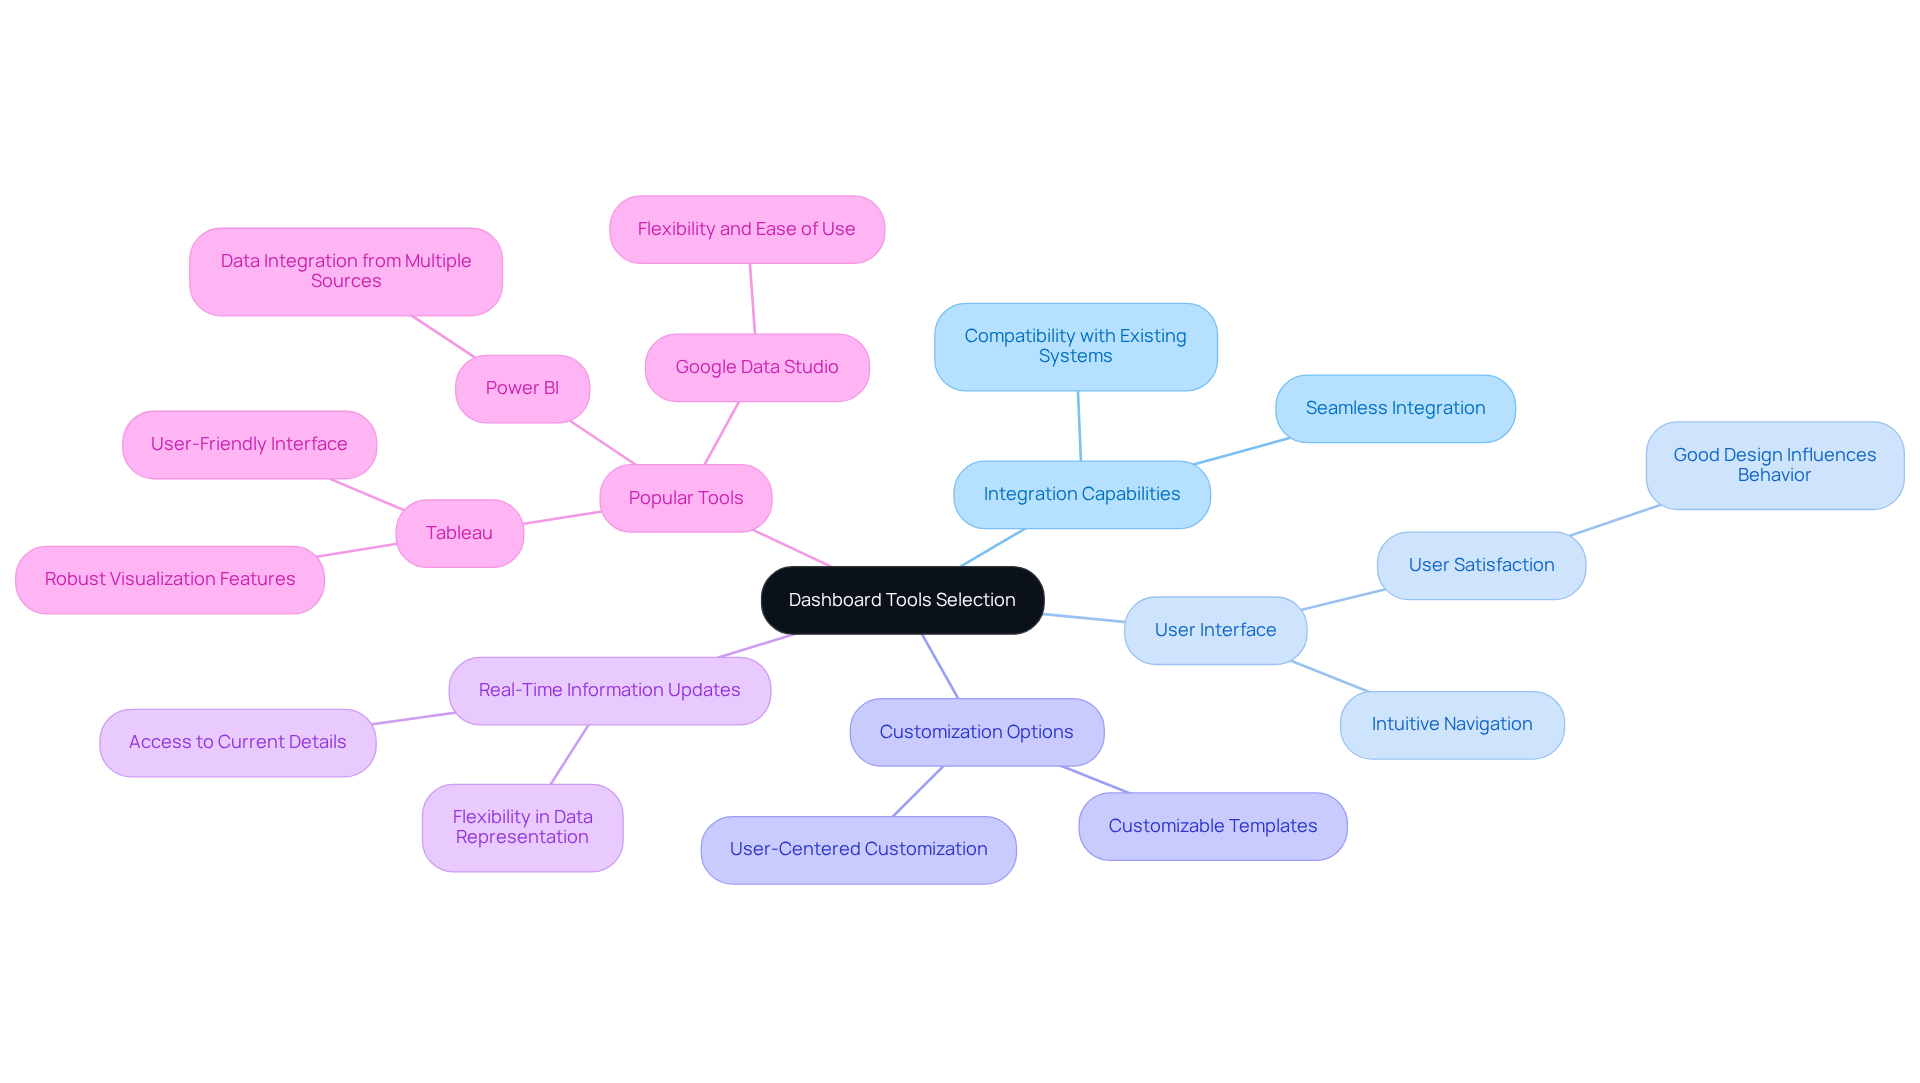
When selecting dashboard tools for title status tracking, several key factors must be prioritized:
- Integration Capabilities: Opt for tools that seamlessly integrate with existing title research systems and databases, ensuring a smooth workflow.
- User Interface: An intuitive interface is essential; it should enable users to navigate and comprehend information effortlessly. As noted by industry leaders, a well-designed user interface can significantly enhance user satisfaction and engagement. Good design positively influences behavior, and effective UI design provides users with a comprehensible sense of power.
- Customization Options: Seek tools that offer customizable templates and visualizations, allowing users to tailor interfaces to their specific needs and preferences. Understanding people is fundamental to creating good design, making user-centered customization crucial.
- Real-Time Information Updates: Select tools that provide real-time information updates, ensuring users have access to the most current details, which is vital for effective decision-making. This flexibility is particularly beneficial when dashboards are expected to represent information from all aspects of the business without relying on IT.
Among the popular tools available, Tableau, Power BI, and Google Data Studio stand out, each offering unique features that can significantly enhance the research process. For instance, Tableau is frequently utilized by real estate firms for monitoring ownership statuses due to its robust visualization features and user-friendly interface. Power BI excels in integrating data from various sources, while Google Data Studio provides flexibility and ease of use, making it suitable for teams aiming to create dynamic reports. By focusing on these elements, organizations can select the most efficient visualization tools, such as dashboards for tracking title status, to simplify their title analysis processes.

Integrate Dashboards into Existing Research Workflows
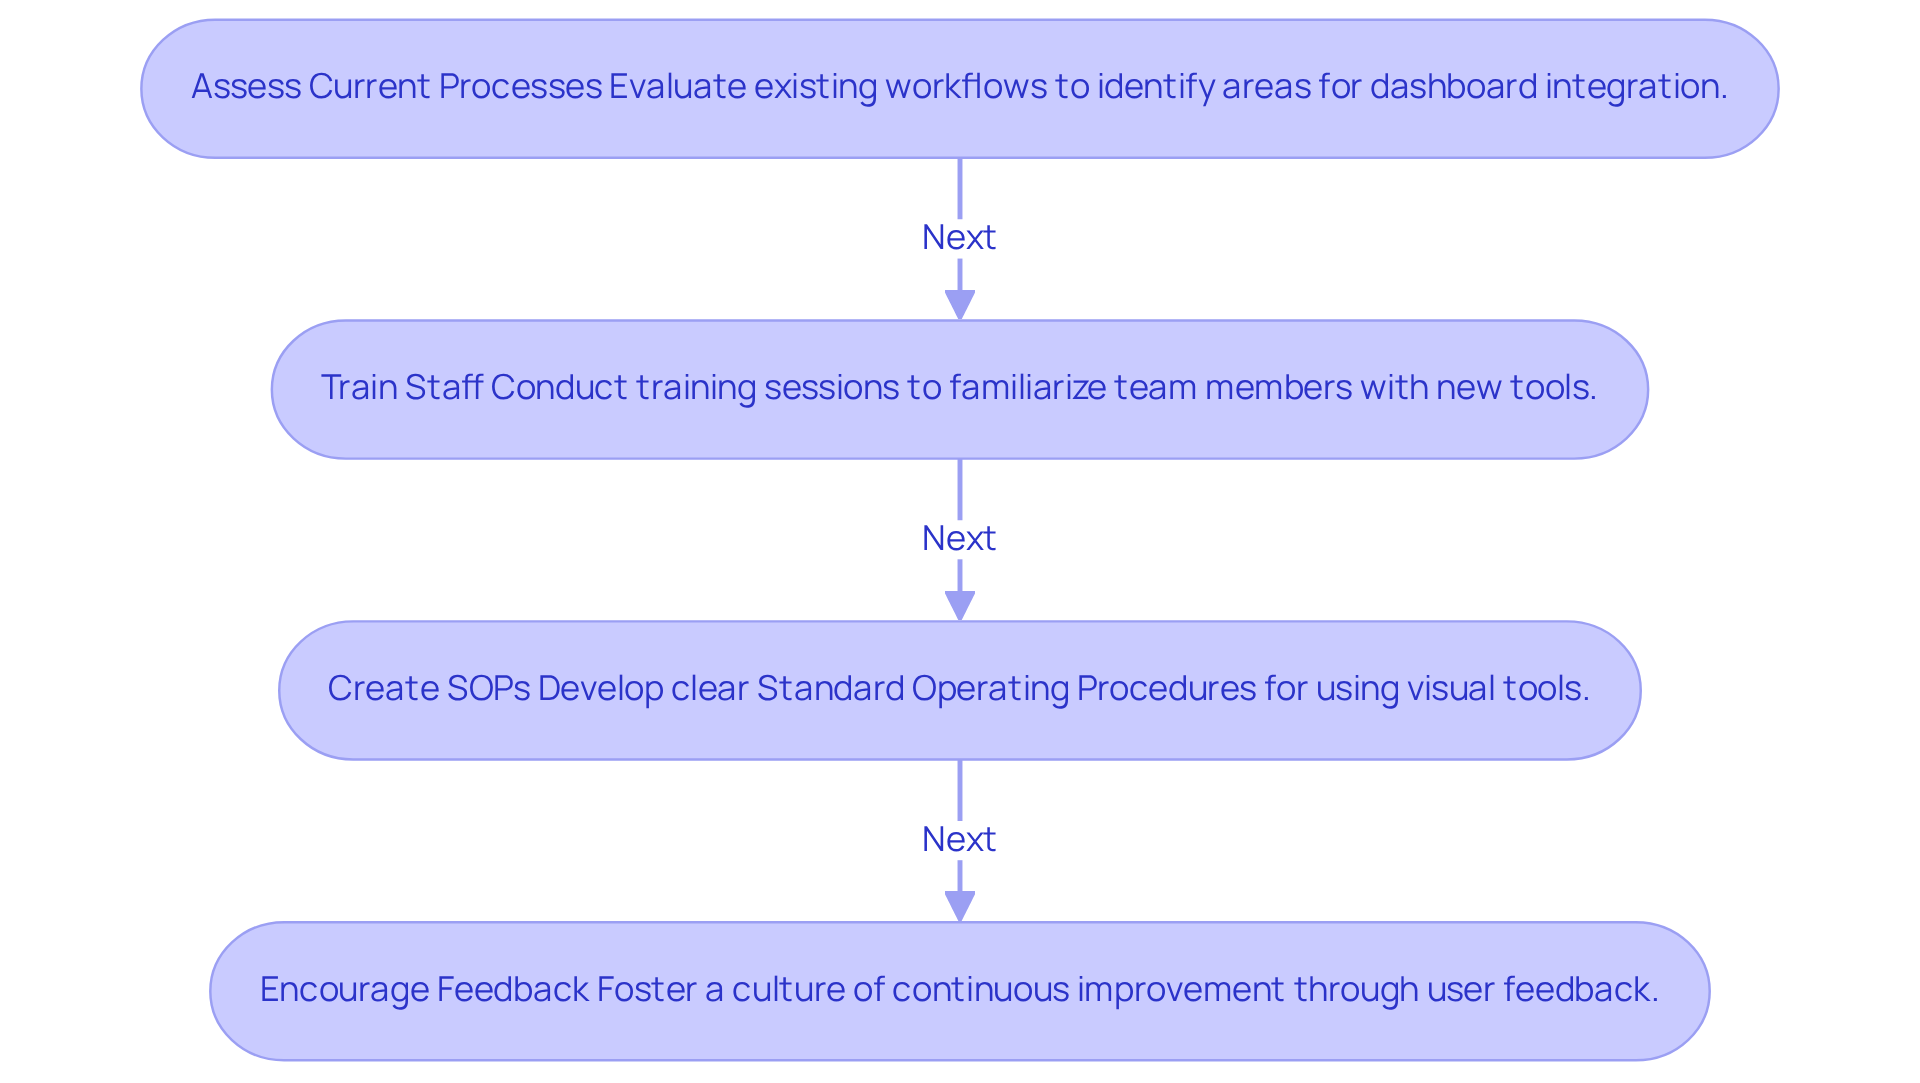
To effectively integrate dashboards into existing research workflows, consider the following strategies:
- Assess Current Processes: Begin by evaluating existing workflows to pinpoint areas where dashboards can enhance efficiency without causing disruption. This assessment is crucial, as organizations that treat analytics as an integrated function often realize significant operational advantages. With Parse AI's advanced machine learning tools, including the example manager, you can expedite document processing and interpretation, making it easier to identify these areas.
- Train Staff: Conduct extensive training sessions for team members to acquaint them with the new interface tools and their functionalities. Research indicates that organizations utilizing embedded analytics report a 67% increase in productive work hours, highlighting the importance of effective training in maximizing tool usage. As Della Shea notes, executive management is more likely to invest in data initiatives when they understand the 'why' behind them, emphasizing the need for clear communication during training. Leveraging Parse AI's user-friendly interface and automated document processing capabilities can facilitate this training process.
- Create Standard Operating Procedures (SOPs): Develop clear SOPs that outline how and when to utilize the visual tools within the research process. This structured approach ensures consistency and helps staff understand the best practices for leveraging these tools. Incorporating Parse AI's automated document processing capabilities into these SOPs can streamline workflows further and enhance overall effectiveness.
- Encourage Feedback: Foster a culture of continuous improvement by motivating team members to provide feedback on the interface's usability and effectiveness. Organizations that prioritize user input often see enhanced engagement and satisfaction, as evidenced by the 37% higher customer satisfaction scores for applications featuring embedded analytics. Moreover, organizations utilizing embedded analytics encounter 43% fewer data inconsistencies, highlighting the accuracy advantages of incorporating visual displays. With Parse AI's and interactive labeling features, feedback can lead to even more refined processes.
By carefully incorporating dashboards for tracking title status into title research processes, organizations can greatly improve their efficiency and precision, ultimately leading to better decision-making and enhanced outcomes.

Establish a Feedback Loop for Continuous Improvement
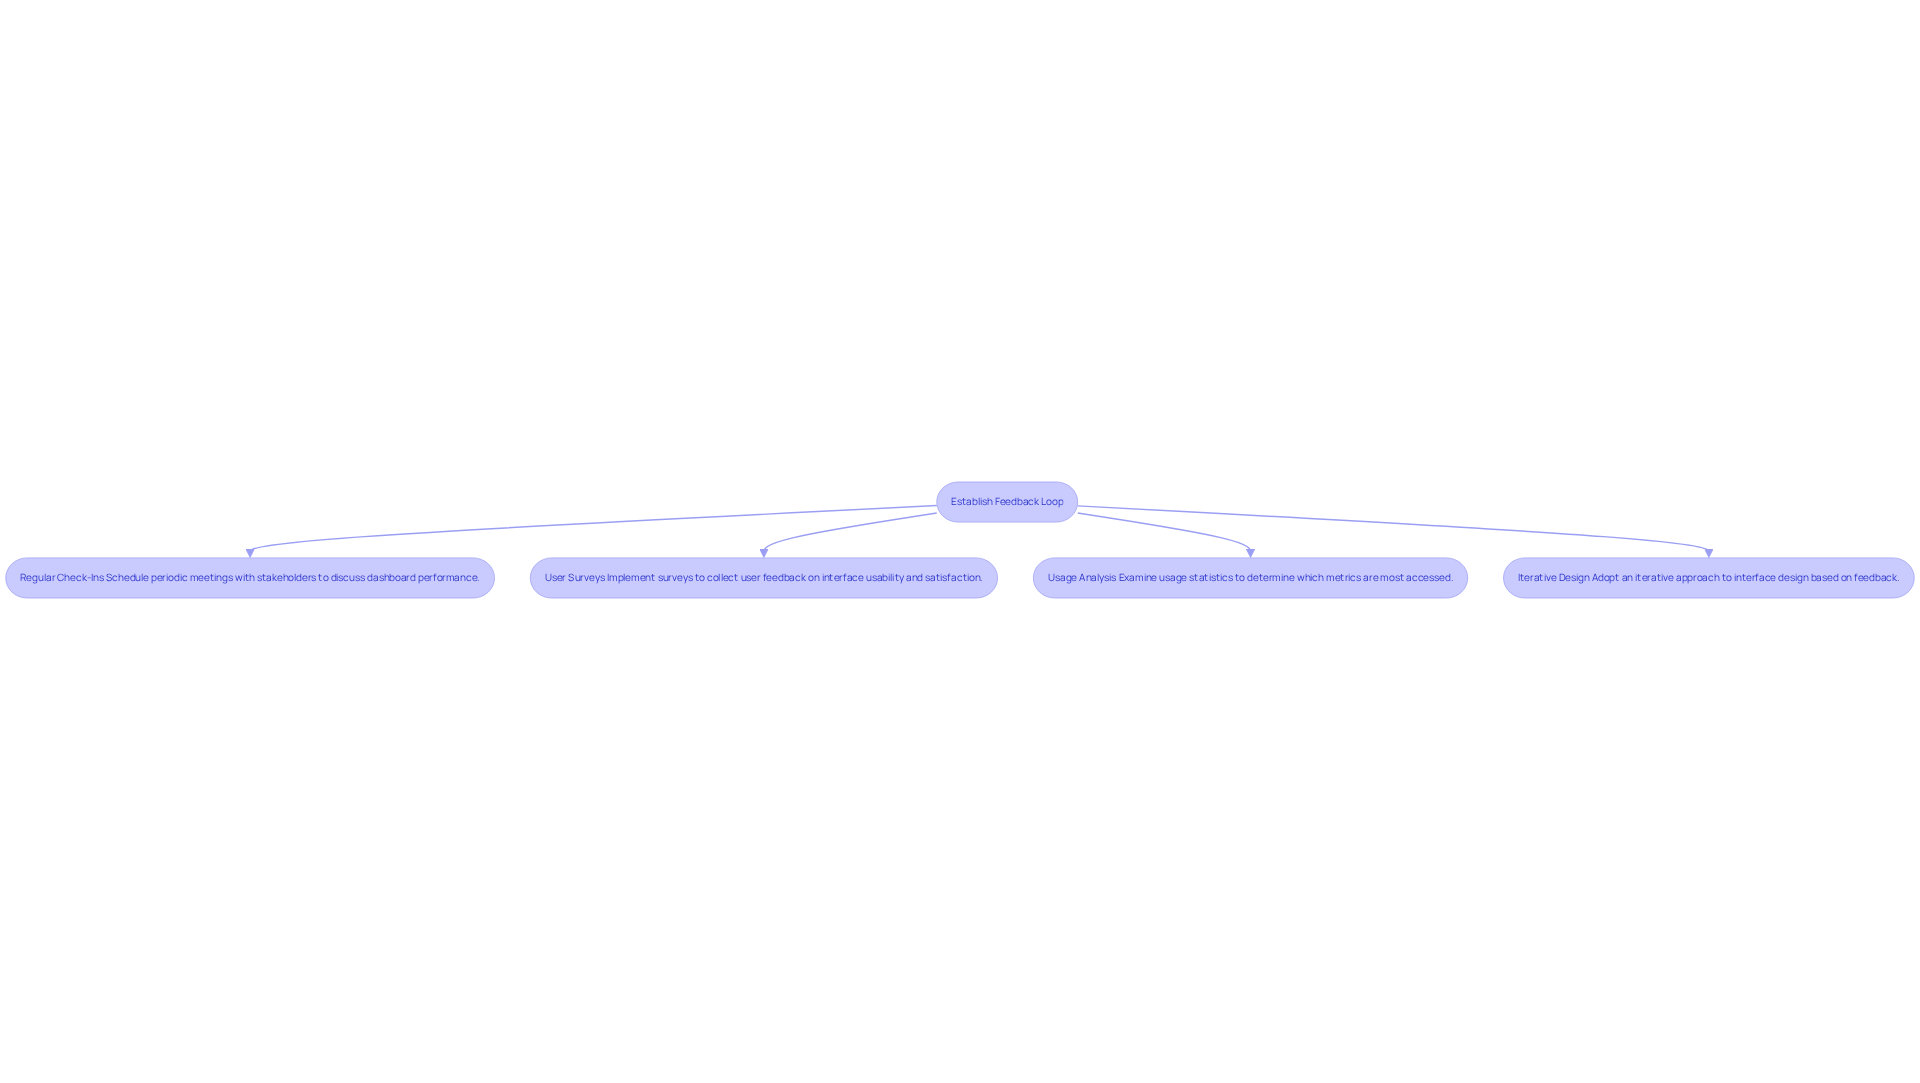
To establish a robust feedback loop for your dashboards, it is essential to consider several .
- Regular Check-Ins: Schedule periodic meetings with stakeholders to discuss dashboard performance and gather insights on potential improvements. Following up with users within 48 hours can double future survey responses and reduce churn by 30%, thereby reinforcing the importance of timely check-ins.
- User Surveys: Implement surveys to collect user feedback on interface usability, information relevance, and overall satisfaction. Engaging users through surveys can yield response rates exceeding 80% in-store and 50% online, providing valuable insights that drive enhancements.
- Usage Analysis: Examine usage statistics to determine which metrics are most commonly accessed and which are overlooked. This analysis can direct future improvements, ensuring that the interface reflects the most relevant information for users.
- Iterative Design: Adopt an iterative approach to interface design, making incremental changes based on feedback and data analysis. This method aligns with the active feedback loop model, which includes asking for feedback, acting on it, and announcing changes. This approach permits ongoing enhancement, guaranteeing that the interface evolves in tandem with the changing requirements of document analysis.
By establishing a feedback loop, organizations can ensure that their dashboards not only meet current demands but also adapt to future challenges, ultimately driving greater efficiency and accuracy in title research.

Conclusion
Implementing effective dashboards for tracking title status is essential for enhancing operational efficiency and decision-making. By concentrating on key performance indicators, selecting suitable tools, integrating these dashboards into existing workflows, and establishing feedback loops, organizations can dramatically enhance their title research processes.
Key strategies include:
- Identifying crucial metrics such as title search completion rates and customer satisfaction scores, which yield insights into performance and areas for improvement.
- The significance of choosing dashboard tools with integration capabilities, user-friendly interfaces, and real-time updates cannot be overstated; these features bolster usability and engagement.
- Integrating dashboards necessitates meticulous planning and training, ensuring that staff can utilize these tools effectively.
- Cultivating a culture of continuous improvement through regular feedback and iterative design enables organizations to adapt their dashboards to meet evolving needs.
In conclusion, the implementation of effective dashboards for tracking title status not only streamlines research processes but also elevates the quality of service provided to clients. Organizations should prioritize these strategies to harness the full potential of their data and drive better outcomes. By embracing these best practices, they will facilitate more informed decision-making and ultimately contribute to sustained success in the competitive landscape of title research.
Frequently Asked Questions
What are key metrics for title status tracking?
Key metrics for title status tracking include Title Search Completion Rate, Error Rate in Document Reports, Average Time to Complete Ownership Searches, and Customer Satisfaction Score.
What does the Title Search Completion Rate measure?
The Title Search Completion Rate measures the percentage of title searches completed within a specified timeframe, providing insight into operational efficiency.
Why is monitoring the Error Rate in Document Reports important?
Monitoring the Error Rate in Document Reports is crucial for evaluating the precision of inquiry processes, which helps maintain industry credibility and client trust.
How does the Average Time to Complete Ownership Searches affect performance?
The Average Time to Complete Ownership Searches indicates the efficiency of the ownership research process, allowing firms to benchmark against industry standards and identify improvement opportunities.
What role does the Customer Satisfaction Score play in title status tracking?
The Customer Satisfaction Score reflects client feedback on the clarity and usefulness of reports, ensuring services meet client expectations and improve overall satisfaction.
How can organizations use these metrics to improve their title evaluation process?
Organizations can use these metrics to track performance through dashboards, gain insights, recognize areas for enhancement, and ultimately improve the effectiveness of the title evaluation process.


